GAP insurance payouts have almost doubled since 2019 - find out why
The typical GAP insurance claim we paid in 2019 settled at £3,240. In 2025, the same figure was £6,096, an increase of 88% in six years.
These figures come from our own claims records rather than a market estimate or an industry survey. They are calculated from completed paid claims reported to us since January 2019, and the full data set is published on our
GAP insurance claims data page.
This article sets out what changed, when it changed, and the market conditions that appear to sit behind it.
What our claims data shows
The graphic covers every completed calendar year since 2019. The average settlement is the total amount paid divided by the number of paid claims. The typical settlement is the median, meaning the middle claim when all settlements are arranged from lowest to highest.
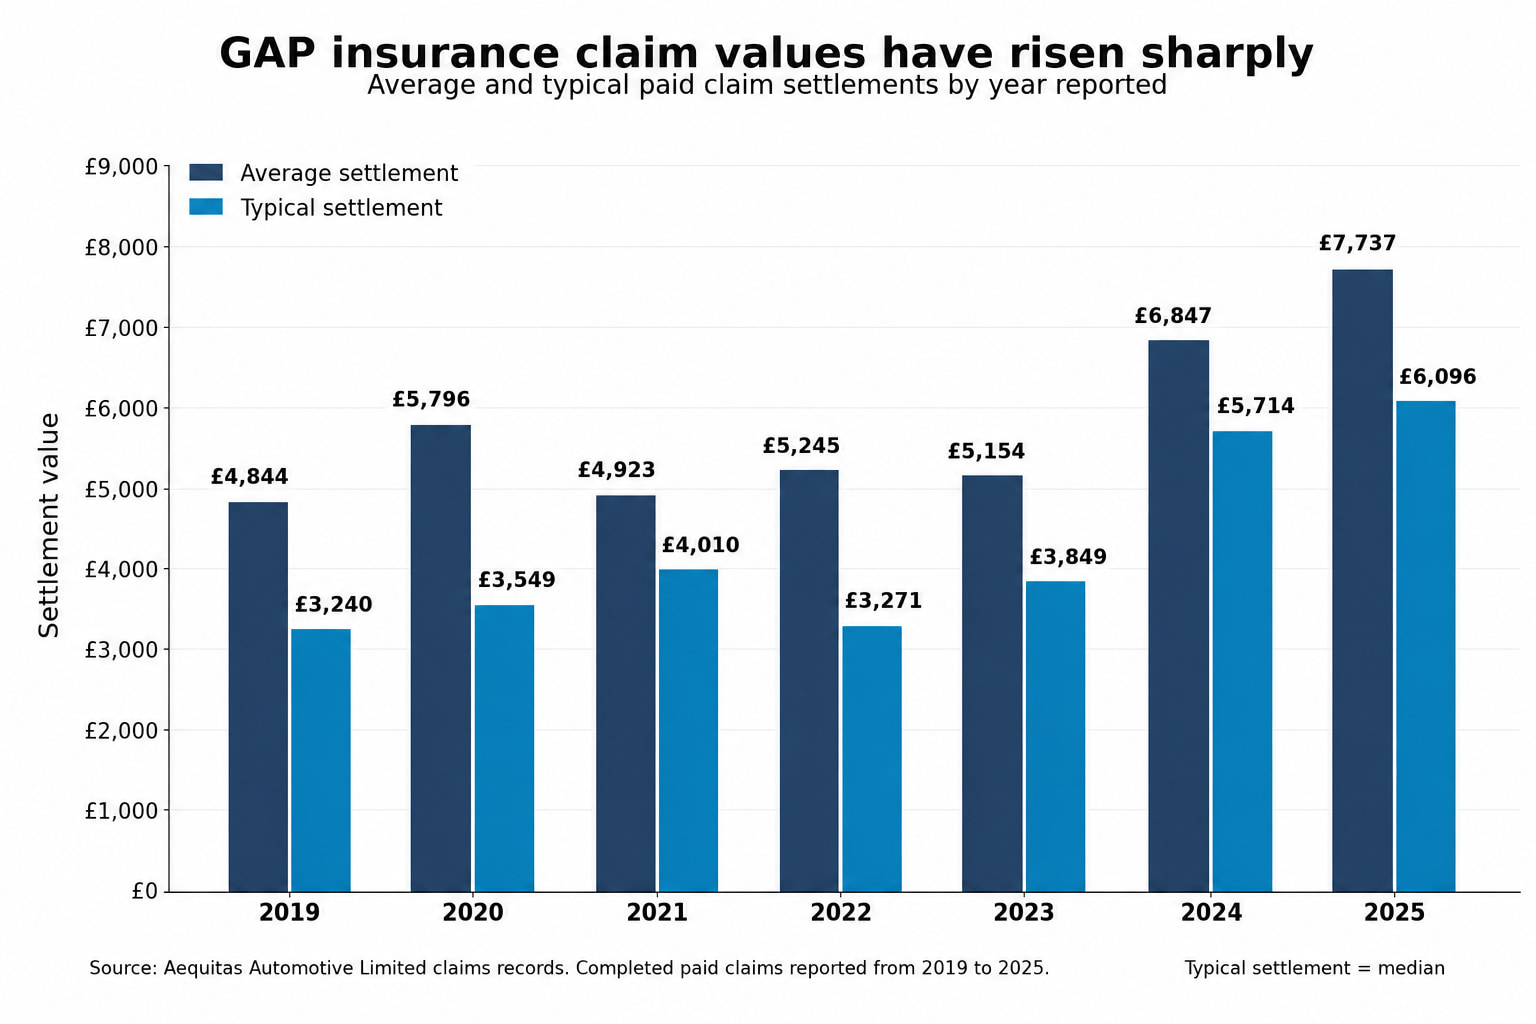
Several years of movement within a fairly narrow range were followed by a clear step upwards in 2024. The typical settlement rose from £3,849 in 2023 to £5,714 the following year, an increase of 48% in twelve months, then rose again to £6,096 in 2025. The average did much the same thing.
So this was not a gradual six-year climb. The bulk of the change happened in a single year, and the higher level has held since.
The increase was not caused by a handful of very large claims
Between 2019 and 2025, the typical settlement rose 88% while the average rose by around 60%. That difference matters. If a few unusually large payouts had been dragging the figures upwards, the average would have moved further than the median. It did the opposite.
The rest of the range moved as well. In 2019, 14.0% of our paid claims settled for £1,000 or less, and 11.5% settled for £10,000 or more. By 2025, the smaller claims had fallen to 5.7% while claims of £10,000 or more had reached 27.3%. Put another way, roughly one claim in seven paid under £1,000 in 2019. By 2025, it was around one in eighteen.
Even the lower end shifted. The smallest quarter of our claims settled at around £1,700 or less in 2019. By 2025, that threshold had risen to around £3,600.
There is one more sign worth mentioning. In 2019, the average sat about 50% above the typical settlement. By 2025, that gap had narrowed to 27%. A wide gap between the two usually means a small number of large claims are pulling the average down. A narrowing gap points the other way, towards higher settlements becoming ordinary across the book rather than exceptional.
The rise appears to have levelled off
Comparing claims reported up to 18 July in each year, the average settlement was around £8,100 in 2025 and around £8,200 in 2026. The typical settlement was close to £6,900 in both.
The 2026 figures are incomplete; several claims remain open, and larger, more complex claims can take longer to settle, so the position could still move. Treat them as directional rather than final.
On what has been completed so far, the evidence points to a shift to a higher level rather than a rise that is still underway.
Why might GAP claims have increased
Our claims records show what happened. They cannot assign a precise share of the increase to any single cause.
What we can do is set the timing against what was happening in the car market, and several changes line up closely. Higher purchase prices. The spike and subsequent correction in the used values. Rising repair costs and total loss rates. Some of these affect the size of the shortfall. Others affect which vehicles are written off in the first place, and therefore which claims reach us at all. They are different mechanisms and should be kept apart.
New cars cost much more than they did
A GAP policy is measured against an amount tied to the vehicle's original price, its replacement cost or the finance position, depending on the type of cover. When purchase prices rise, the amount exposed to depreciation rises. GEM Motoring Assist, drawing on CPI data, reports that car prices have risen by around 25% since 2020. Industry sources, including Auto Trader and NimbleFins, put the increase higher, at 30% to 40%, crediting it to supply chain disruption, semiconductor and parts shortages, inflation, and higher production costs.
The cheaper end of the market shows it most clearly. NimbleFins calculated that by January 2026, the average base price across three of Britain's best-selling small cars had reached £22,782. This is roughly £7,000 more than five or six years ago.
The arithmetic that follows is simple enough. A 20% shortfall on a £20,000 car is £4,000. The same 20% on a £35,000 car is £7,000. Nothing has to depreciate any faster for the claim to be bigger. The starting figure is just larger.
Used values rose sharply, then corrected
This part is often described badly, so it is worth being careful.
Used values did not collapse. Cap HPI data reported by Fleet News shows that market-wide values have remained around 30% above pre-pandemic figures despite the corrections of recent years. That said, an index describes the market as a whole. Individual makes, models, and fuel types have not all followed the same path, and some have fallen much further.
It is worth looking at the timeline over the last few years. Values climbed steeply through 2021 and 2022 as supply dried up, then came back down. Cap HPI figures reported by Car Dealer Magazine show values falling 10.5% across the final quarter of 2023, followed by a milder 4.2% decline over the same period in 2024.
The buyers exposed by that sequence are the ones who purchased at the top. A motor insurer may later value a car bought at an unusually high price in 2021 or 2022 after the market has moved down underneath it. That widens the space between what the customer paid, what they still owe, what a replacement now costs, and what the motor insurer is willing to settle at.
Exactly how a GAP Insurance claim works depends on the policy bought.
Finance-based cover, like
Lease GAP Insurance, considers the outstanding balance, where the vehicle's market value can decline faster than the amount owed.
The calculations differ, but all three can produce a larger claim when the motor insurer's settlement falls further from the protected amount. This is the ‘gap’ that is covered.
A vehicle bought near the peak in 2021 or 2022 and written off in 2024 or 2025 fits the timing of the step change in our figures. That is consistency rather than proof, but the two movements sit closely together.
More damaged vehicles are being written off
The third factor gets less attention than the other two, and it may be the most interesting.
Activate Group reports that the share of damaged vehicles declared a total loss has risen from around 55% in 2019 to 66% in 2025, having peaked at roughly 73% in 2023. Insurance payouts rose 18% within twelve months around that peak, according to ABI figures cited in the same analysis.
Repair cost is the key.
ATF Professional reports that labour, parts, materials, together with Advanced Driver Assistance System calibration, have pushed repair costs up by nearly 25% since 2019. This can force more borderline cases over the write-off threshold.
The Association of British Insurers reported that the average accidental damage claim reached £3,699 in the first quarter of 2026, up 8% on the previous quarter.
Parts prices and vehicle complexity continued to push costs higher and make repairs more difficult.
Electric vehicles are impacted more than most. Blackcircles notes that battery diagnostics and potential replacement costs can easily turn a low-speed impact into a total loss.
In contrast, the same knock on a petrol equivalent would have been a manageable repair.
Higher repair costs do not make any individual GAP shortfall larger. What they change is which vehicles are written off and, therefore, which vehicles enter the GAP claims process at all. A car that would once have been repaired may now be declared a total loss after moderate damage.
Whether that produces a large claim still depends on the usual things. How much the vehicle has depreciated, what it originally cost, how it was financed, the type of cover held, the policy limit, and what the motor insurer settles at.
What this means if you are buying cover now
Across our paid claims, the typical shortfall in 2025 was almost twice that in 2019. That is what our own book shows. It does not prove that every provider, product or customer has seen the same change.
Nor does it mean everyone needs GAP insurance. Whether the cover suits you depends on what you paid for the vehicle, whether it was new or used, how quickly it is likely to depreciate, the size of your deposit, how it is financed, how long you plan to keep it, the type of cover you are considering, and how much of a shortfall you could meet yourself. A policy that does not match your circumstances is worth little regardless of what the average claim looks like.
Two things worth being straight about. Settlement values have levelled off rather than continuing to climb, so we are not going to tell you the gap is still widening. And past claims are not a guide to what any individual policy will pay. Any settlement depends on the policy wording, the vehicle, the protected amount, the policy limit and the settlement offered by your motor insurer.
How we compiled these figures
Our data covers GAP Insurance claims reported between 1 January 2019 and 18 July 2026. These are GAP insurance policies sold by our brands
Total Loss GAP,
EasyGAP and
GAPInsurance123.
Claims are grouped by the year they were reported, not the year the policy was purchased.
The annual figures for 2019 to 2025 use only completed paid claims.
Claims still open at the reporting date are excluded from all settlement values and averages, which is why no completed annual figure is shown for 2026.
Our
claims data page carries the full set, including headline settlement figures, payout bands and the recorded decline rate. It is updated periodically.
Sources
- Activate Group, Record total loss rates: why are more vehicles being written off by insurers?
- ATF Professional, The future of total loss is changing, and insurers may need to rethink their partners
- Association of British Insurers, Motor premiums remain stable, but cost of repairs still high
- GEM Motoring Assist, 2026 new car prices: what's the UK average?
- NimbleFins, Average cost of cars UK 2026
- Car Dealer Magazine, Used car values fell in December but Cap HPI sees reasons to be cheerful heading into 2025
- Fleet News, Cap HPI used car market reporting
- Blackcircles, UK car damage categories explained


